

Written by Deanna Fourt, Policy & Advocacy Working Group Lead
As leaves fall from the trees this year, it is a great time to reflect on how things are going and also, apparently, for elections! A municipal election provides an opportunity to look back on what the previous council accomplished and to look ahead to the work the new council has in front of it. It is therefore timely that the City of Nanaimo reviewed its Monitoring Strategy with key stakeholders at the Monitoring Matters event on October 1, 2026. The past council had four years to implement policies and goals set out in the ReImagine Nanaimo City Plan, and annual check-ins allow council, planners, and citizens to see whether progress is being made and where course corrections or increased effort are needed.
At the Monitoring Matters event on October 1st, fellow Nanaimo Climate Action Hub (NCAH) Board member Felix Surjadjaja and I sat down at the Green Nanaimo table for a deep dive with City of Nanaimo staff, representatives from Nanaimo & Area Land Trust (NALT), and Councillor Ben Geselbracht. As might be expected for long-term goals, many of them are not yet being met, and some are trending in the wrong direction (see the city’s monitoring website for performance metrics from previous years). The most concerning, as shown in the following spider web graphs, are the city’s greenhouse gas emissions (GHG) reduction and neighbourhood tree canopy coverage. Other metrics such as fresh water quality and residential waste diversion are also not meeting the targets. In this graph, the closer the metric is to the center of the web, the farther we are from meeting the goal.
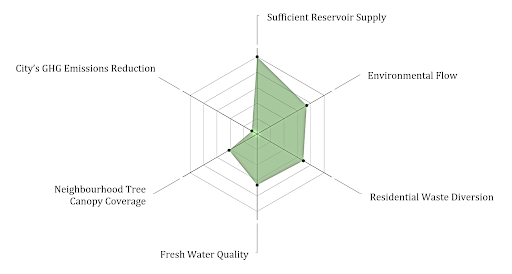
Spiderweb graphic. The outer edge of the spiderweb indicates the current performance metric for that indicator is at the city’s target level and the centre of the spiderweb indicates the current performance metric is zero. For example, reservoir supply performance is 100% because there was adequate water in the reservoir 365/365 days in 2025, and waste diversion performance is 69% because the city aims for 90% of waste to be diverted and in 2025, 62% of waste was diverted (62/90=69%). The GHG metric represents the target 2050 GHG emissions as a percentage of the current GHG emissions.
anaimo has been recognized internationally, nationally, and provincially for its exceptional integration of climate action into the official community plan. Our city is a leader in many ways, including early adoption of the zero carbon step code, innovative waste separation bylaws, electrification of municipal operations, and transparent progress monitoring. But our city's not on track to meet our 2030 and 2050 greenhouse gas emissions reduction targets, of 50-58% and 94-107% below 2010 levels, respectively. The data showed a dip in emissions in 2022 and 2023, with emissions trending back up in 2024 and 2025 above 2010 emission level.
A deeper look at the data shows that transportation contributes the most greenhouse gas emissions, followed by buildings, then waste, and lastly corporate (emissions from City of Nanaimo operations). In fact, transportation accounts for almost twice the emissions of all other categories combined. Although these numbers may seem discouraging, emissions per person have steadily decreased since 2020! As one of Canada's fastest-growing cities, it is promising to see this per person trend even as the city grows. BUT the questions we have to ask ourselves and our elected council are: how do we keep working toward our targets, and what specific policies should we be advocating for?
We know transportation is the largest source of emissions, so we can look there for opportunities, and the Connected Communities data, which shows how we get around our city, offers some revealing information. Car ownership has unfortunately gone up while access to basic daily needs within walking distance is dismally low. I was surprised to see that walking, transit, and biking make up only 10% of trips in the city. Most people who travel around the city probably know that Nanaimo’s long, drawn-out geography is designed for car usage because of past planning decisions. Past urban planning determines if basic daily needs are within walking distance, or whether car use is required. It takes years for zoning decisions to translate into completed construction projects, and most of Nanaimo’s infrastructure and buildings were planned and built decades ago. Approval of residential developments close to urban hubs is essential, while approvals away from urban hubs continue to lock us into a car-centric community (such as 3400 Barrington Road and the Sandstone Development both initiated prior to the ReImagine City Plan).
Shifting away from car usage through urban planning is a long-range endeavour. Increasing safe cycling and walking infrastructure is important, but while we wait for biking and walking connectivity to be built out and urban hubs to develop, focusing on improving and expanding transit could help reduce car travel. Frequency, reliability, and convenience will be necessary to get drivers to leave their vehicles at home, as will simplicity, safety, and comfort (especially while waiting for the bus). We commend the 2022-2026 RDN board for increasing transit hours by about 12% and making transit free for youth under 18 starting this year!
Can we also consider tree canopy coverage, another important measure of environmental health that is not meeting the target? Could we plant trees at bus stops to provide summer shade and ensure safe, tree-lined pathways to transit corridors? Including more trees and native vegetation in other areas of planning will help increase tree canopy throughout the community. Certainly, the policies and changes needed must consider the interconnected aspects of the environment and the city's livability.
Working on one target without considering the effect on other key impact areas, especially those that are also out of range, will not achieve a balanced city environment. Annual monitoring collaborative sessions allow stakeholders and city planners to consider opportunities that provide positive results across interconnected key impact areas. Support and advocacy from Nanaimo Climate Action Hub members will also be important to ensure plans and policies are supporting the city's vital goals and targets.
Here are links to the City of Nanaimo’s Monitoring Strategy and to graphs created by Felix Surjadjaja based on the city’s data.